


Grafana的API Key+Nginx反向代理实现Grafana免登录访问
利用Grafana的API Key+Nginx反向代理实现Grafana免登录访问
需求背景:
- 1、无需提供密码给用户,可以让用户直接浏览器免登录访问Grafana大屏
- 2、并且用户只有浏览的权限,无法配置Grafana及修改配置
- 3、直接80端口访问grafana,无需访问grafana默认的3000端口
基于以上几个要求,通过搜索引擎查询相关文章,总结出具体的实现步骤
一、修改/etc/grafana/grafana.ini
/etc/grafana/grafana.ini配置文件修改,允许嵌入
cat /etc/grafana/grafana.ini  | grep allow_embedding
sed -i "s/;allow_embedding = false/allow_embedding = true/g" /etc/grafana/grafana.ini
cat /etc/grafana/grafana.ini  | grep allow_embedding
systemctl restart grafana-server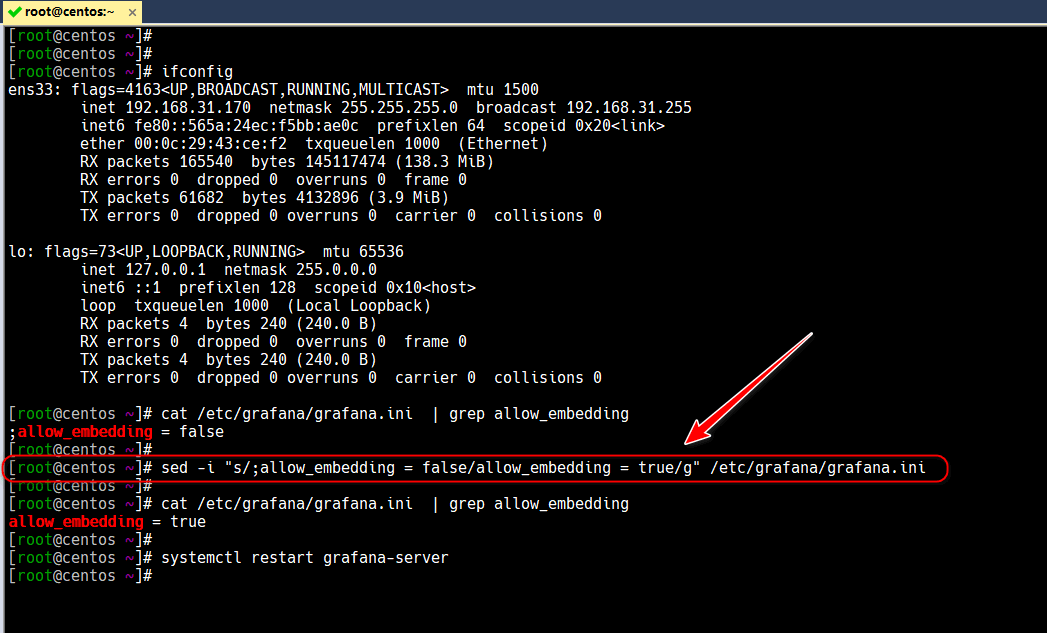
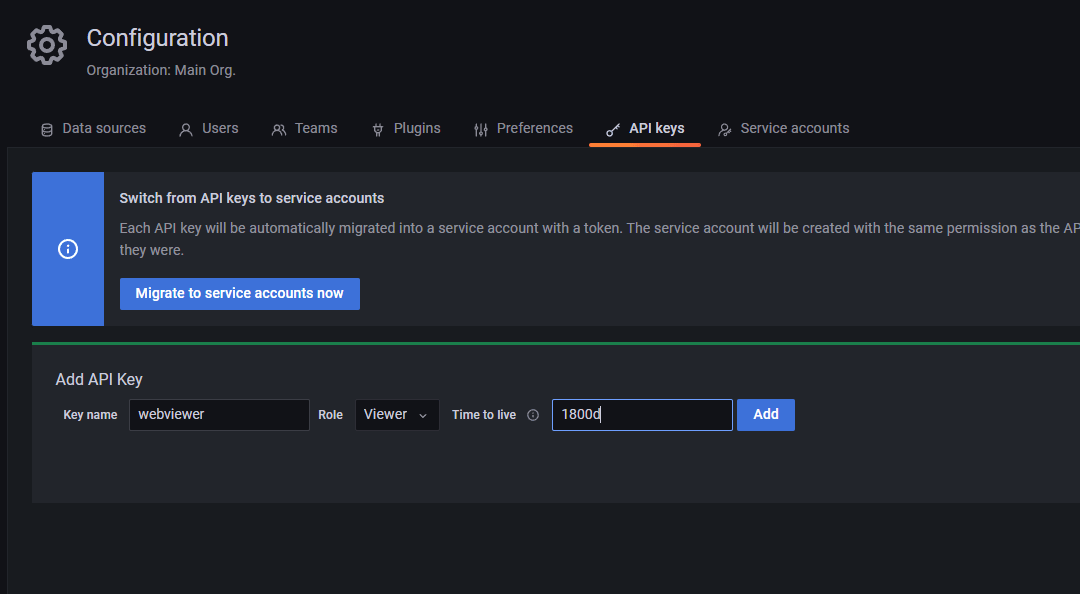
二、Granfana添加API Key
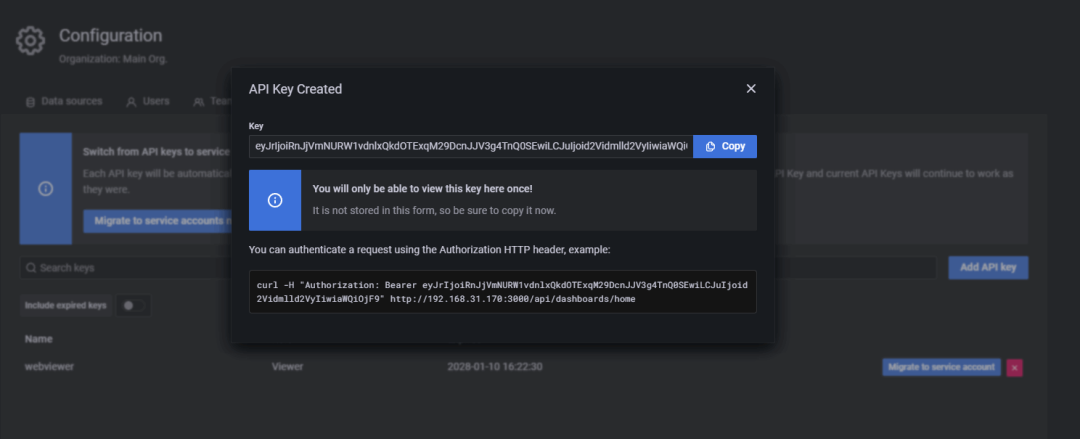
拷贝一下生成的API Key
eyJrIjoiRnJjVmNURW1vdnlxQkdOTExqM29DcnJJV3g4TnQ0SEwiLCJuIjoid2Vidmlld2VyIiwiaWQiOjF9

curl -H "Authorization: Bearer eyJrIjoiRnJjVmNURW1vdnlxQkdOTExqM29DcnJJV3g4TnQ0SEwiLCJuIjoid2Vidmlld2VyIiwiaWQiOjF9" http://192.168.31.170:3000/api/dashboards/home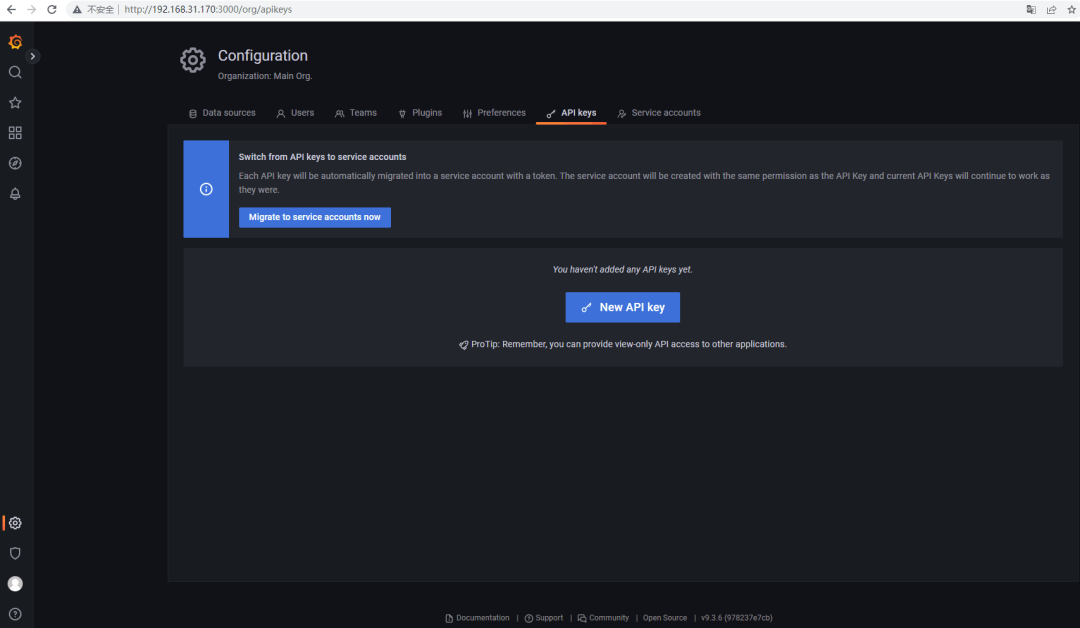
三、配置nginx的yum源并安装配置nginx
1、配置nginx的yum源并安装nginx
cat > /etc/yum.repos.d/nginx.repo  << \EOF
[nginx-stable]
name=nginx stable repo
baseurl=http://nginx.org/packages/centos/$releasever/$basearch/
gpgcheck=1
enabled=1
gpgkey=https://nginx.org/keys/nginx_signing.key
module_hotfixes=true
EOF

yum install nginx -y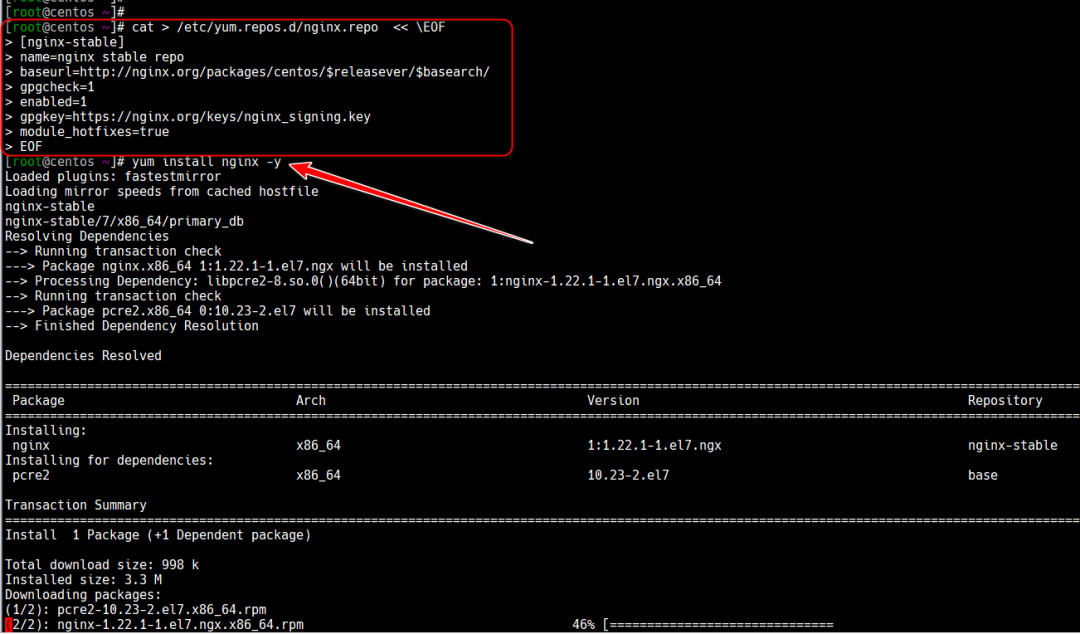
2、【可选】修改默认的nginx配置文件nginx.conf
可以自行修改为json格式的格式日志数据输出
[root@centos nginx]# cat nginx.conf
user nginx;
worker_processes auto;
error_log /var/log/nginx/error.log notice;
pid /var/run/nginx.pid;
events {
worker_connections 1024;
}
http {
include /etc/nginx/mime.types;
default_type application/octet-stream;
# log_format main '$remote_addr - $remote_user [$time_local] "$request" '
# '$status $body_bytes_sent "$http_referer" '
# '"$http_user_agent" "$http_x_forwarded_for"';
# access_log /var/log/nginx/access.log main;
log_format json_analytics escape=json '{'
'"msec": "$msec", ' # request unixtime in seconds with a milliseconds resolution
'"connection": "$connection", ' # connection serial number
'"connection_requests": "$connection_requests", ' # number of requests made in connection
'"pid": "$pid", ' # process pid
'"host": "$host", '
'"remote_addr": "$remote_addr", ' # client IP
'"remote_user": "$remote_user", ' # client HTTP username
'"remote_port": "$remote_port", ' # client port
'"time_local": "$time_local", '
'"time_iso8601": "$time_iso8601", ' # local time in the ISO 8601 standard format
'"request_method": "$request_method", ' # request method
'"request": "$request", ' # full path no arguments if the request
'"request_uri": "$request_uri", ' # full path and arguments if the request
'"request_id": "$request_id", ' # the unique request id
'"request_length": "$request_length", ' # request length (including headers and body)
'"request_time": $request_time, '
'"args": "$args", ' # args
'"response_status": "$status", ' # response status code
'"body_bytes_sent": "$body_bytes_sent", ' # the number of body bytes exclude headers sent to a client
'"bytes_sent": "$bytes_sent", ' # the number of bytes sent to a client
'"http_version": "$server_protocol", '
'"http_referer": "$http_referer", ' # HTTP referer
'"http_user_agent": "$http_user_agent", ' # user agent
'"http_x_forwarded_for": "$http_x_forwarded_for", ' # http_x_forwarded_for
'"http_x_forwarded_proto": "$http_x_forwarded_proto", '
'"http_host": "$http_host", ' # the request Host: header
'"server_name": "$server_name", ' # the name of the vhost serving the request
'"request_time": "$request_time", ' # request processing time in seconds with msec resolution
'"upstream": "$upstream_addr", ' # upstream backend server for proxied requests
'"upstream_connect_time": "$upstream_connect_time", ' # upstream handshake time incl. TLS
'"upstream_header_time": "$upstream_header_time", ' # time spent receiving upstream headers
'"upstream_response_time": "$upstream_response_time", ' # time spend receiving upstream body
'"upstream_response_length": "$upstream_response_length", ' # upstream response length
'"upstream_cache_status": "$upstream_cache_status", ' # cache HIT/MISS where applicable
'"ssl_protocol": "$ssl_protocol", ' # TLS protocol
'"ssl_cipher": "$ssl_cipher", ' # TLS cipher
'"scheme": "$scheme", ' # http or https
'"server_protocol": "$server_protocol", ' # request protocol, like HTTP/1.1 or HTTP/2.0
'"pipe": "$pipe", ' # "p" if request was pipelined, "." otherwise
'"gzip_ratio": "$gzip_ratio", '
'"http_cf_ray": "$http_cf_ray"'
'}';
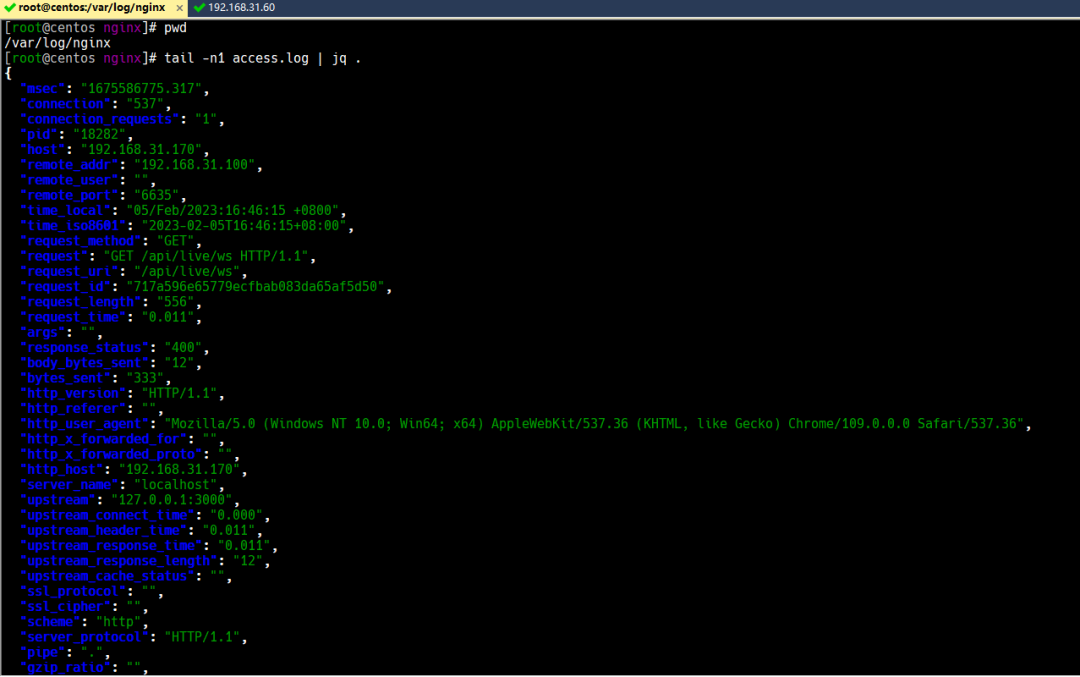
access_log /var/log/nginx/access.log json_analytics;
sendfile on;
#tcp_nopush on;
keepalive_timeout 65;
#gzip on;
include /etc/nginx/conf.d/*.conf;
}输出的json日志美化后的效果如下
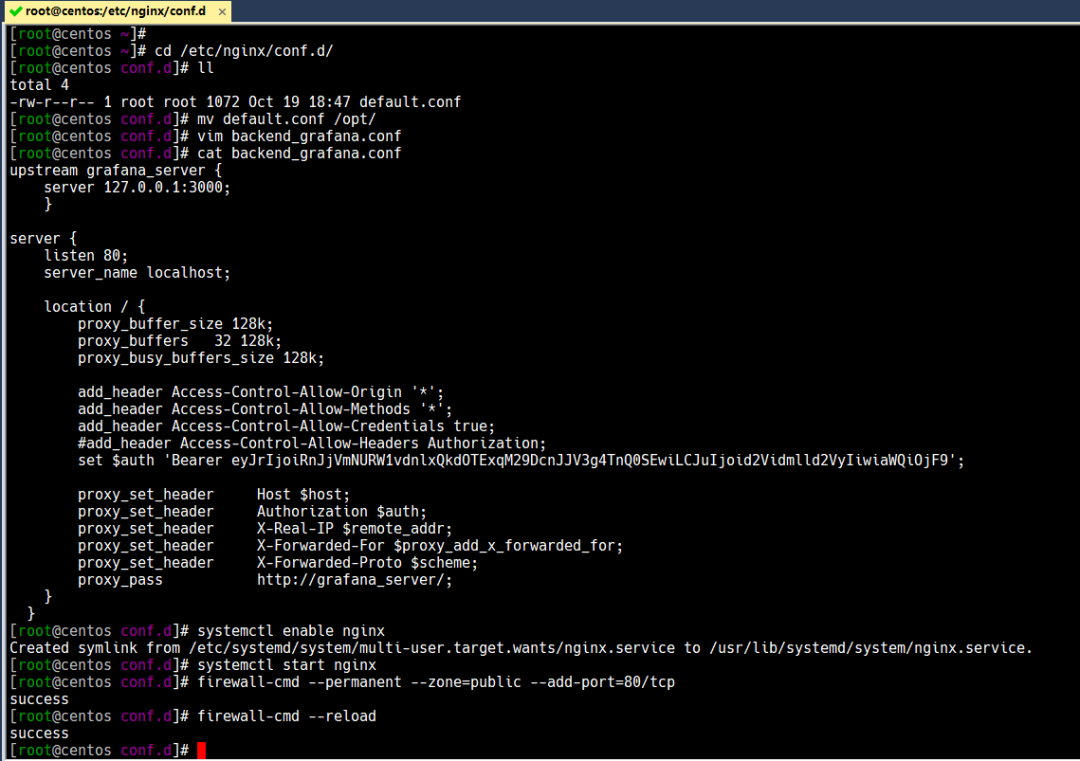
3、添加grafana反向代理配置
cd /etc/nginx/conf.d/
mv default.conf /opt/
vim backend_grafana.conf
# 添加如下配置,其中API Key为上一步中的grafana api_key
upstream grafana_server {
    server 127.0.0.1:3000;
    }

server {
    listen 80;
    server_name localhost;

    location / {
        proxy_buffer_size 128k;
        proxy_buffers   32 128k;
        proxy_busy_buffers_size 128k;

        add_header Access-Control-Allow-Origin '*';
        add_header Access-Control-Allow-Methods '*';
        add_header Access-Control-Allow-Credentials true;
        #add_header Access-Control-Allow-Headers Authorization;
        set $auth 'Bearer eyJrIjoiRnJjVmNURW1vdnlxQkdOTExqM29DcnJJV3g4TnQ0SEwiLCJuIjoid2Vidmlld2VyIiwiaWQiOjF9';

        proxy_set_header     Host $host;
        proxy_set_header     Authorization $auth;
        proxy_set_header     X-Real-IP $remote_addr;
        proxy_set_header     X-Forwarded-For $proxy_add_x_forwarded_for;
        proxy_set_header     X-Forwarded-Proto $scheme;
        proxy_pass           http://grafana_server/;
    }
  }
systemctl enable nginx
systemctl start nginx
firewall-cmd --permanent --zone=public --add-port=80/tcp
firewall-cmd --reload
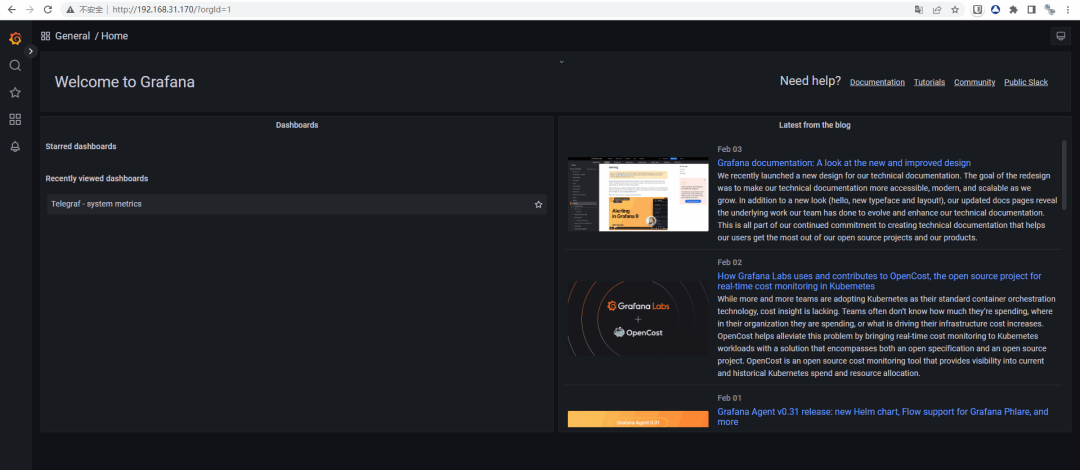
四、测试免登录效果
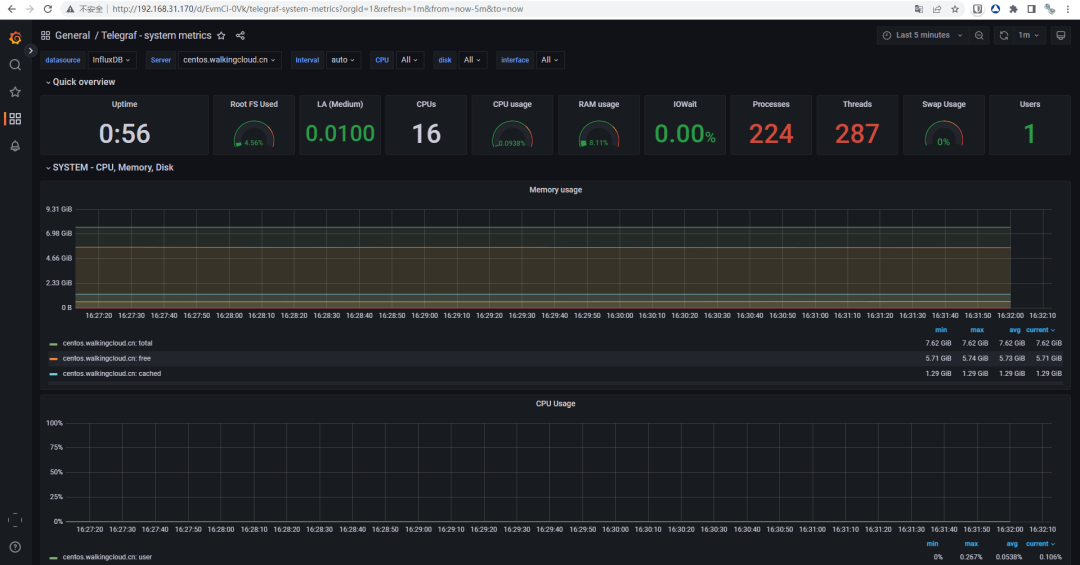
直接80端口访问grafana且无需输入账号密码
http://192.168.31.170
五、Tips
1、当然你也可以使用firewalld的rich-rule来控制访问80端口的来源IP
具体步骤
firewall-cmd --permanent --zone=public --remove-port=80/tcp
firewall-cmd --permanent --add-rich-rule='rule family="ipv4" source address='192.168.31.100' port port="80" protocol="tcp" accept'
firewall-cmd --reload

(图片点击放大查看)
例如192.168.31.60 访问grafana 80端口直接拒绝
curl -H "Authorization: Bearer eyJrIjoiRnJjVmNURW1vdnlxQkdOTExqM29DcnJJV3g4TnQ0SEwiLCJuIjoid2Vidmlld2VyIiwiaWQiOjF9" http://192.168.31.170/api/dashboards/home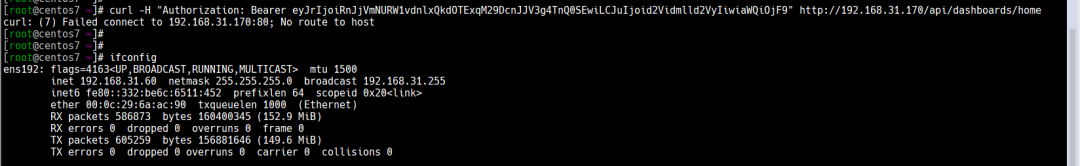
(图片点击放大查看)
2、本文参考如下链接实现
https://blog.csdn.net/qq_24985201/article/details/122670276