


为什么要使用 Loki
这篇文章着重介绍了 grafana 公司开发的 loki 日志收集应用。Loki 是一个轻量级的日志收集、分析的应用,采用的是 promtail 的方式来获取日志内容并送到 loki 里面进行存储,最终在 grafana 的 datasource 里面添加数据源进行日志的展示、查询。
loki 的持久化存储支持 azure、gcs、s3、swift、local 这 5 中类型,其中常用的是 s3、local。另外,它还支持很多种日志搜集类型,像最常用的 logstash、fluentbit 也在官方支持的列表中。
那它有哪些优点呢?
- 支持的客户端,如 Promtail,Fluentbit,Fluentd,Vector,Logstash 和 Grafana Agent
- 首选代理 Promtail,可以多来源提取日志,包括本地日志文件,systemd,Windows 事件日志,Docker 日志记录驱动程序等
- 没有日志格式要求,包括 JSON,XML,CSV,logfmt,非结构化文本
- 使用与查询指标相同的语法查询日志
- 日志查询时允许动态筛选和转换日志行
- 可以轻松地计算日志中的需要的指标
- 引入时的最小索引意味着您可以在查询时动态地对日志进行切片和切块,以便在出现新问题时回答它们
- 云原生支持,使用 Prometheus 形式抓取数据
各日志收集组件简单对比
| 名称 | 安装的组件 | 优点 |
|---|---|---|
| ELK/EFK | elasticsearch、logstash、kibana、filebeat、kafka/redis | 支持自定义 grok 正则解析复杂日志内容;dashboard 支持丰富的可视化展示 |
| Loki | grafana、loki、promtail | 占用资源小;grafana 原生支持;查询速度快 ; |
Loki 工作方式解惑
日志解析格式
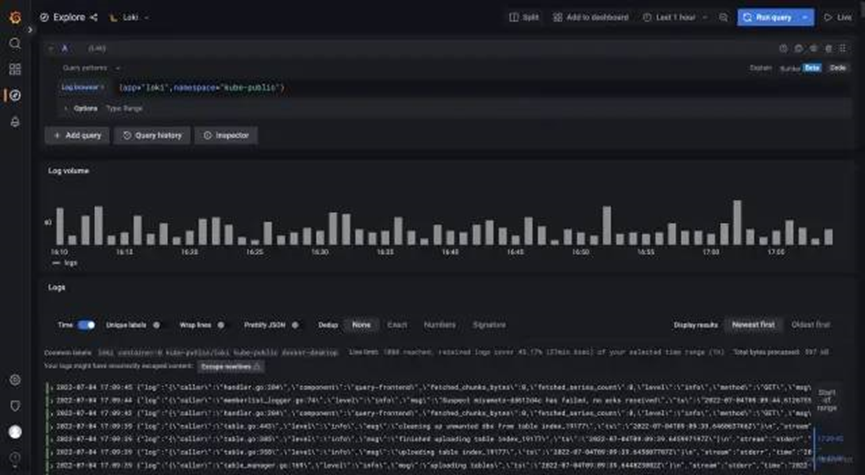
从上面的图中我们可以看到,它在解析日志的时候是以 index 为主的,index 包括时间戳和 pod 的部分 label(其他 label 为 filename、containers 等),其余的是日志内容。具体查询效果如下:
{app="loki",namespace="kube-public"} 为索引。
日志搜集架构模式
在使用过程中,官方推荐使用 promtail 做为 agent 以 DaemonSet 方式部署在 kubernetes 的 worker 节点上搜集日志。另外也可以用上面提到的其他日志收集工具来收取,这篇文章在结尾处会附上其他工具的配置方式。
Loki 部署模式都有哪些呢
Loki 由许多组件微服务构建而成,微服务组件有 5 个。在这 5 个里面添加缓存用来把数据放起来加快查询。数据放在共享存储里面配置 memberlist_config 部分并在实例之间共享状态,将 Loki 进行无限横向扩展。在配置完 memberlist_config 部分后采用轮询的方式查找数据。为了使用方便官方把所有的微服务编译成一个二进制,可以通过命令行参数-target 控制,支持 all、read、write,我们在部署时根据日志量的大小可以指定不同模式。
all(读写模式)
服务启动后,我们做的数据查询、数据写入都是来自这一个节点。请看下面的这个图解:

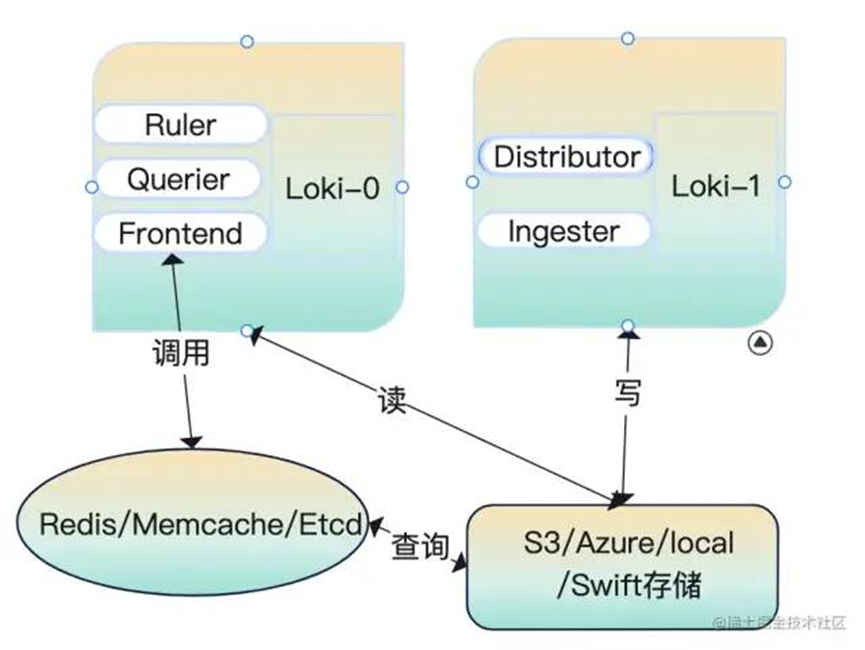
read/write(读写分离模式)
在读写分离模式下运行时 fronted-query 查询会将流量转发到 read 节点上。读节点上保留了 querier、ruler、fronted,写节点上保留了 distributor、ingester。
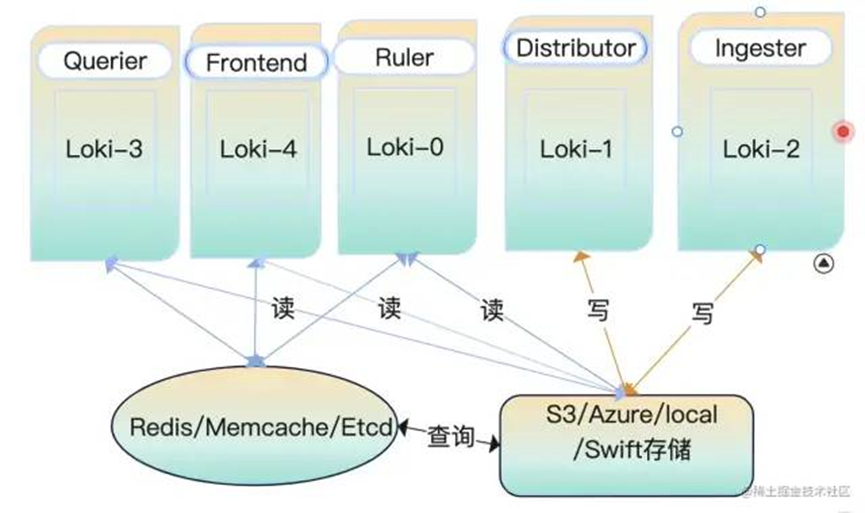
微服务模式运行
微服务模式运行下,通过不同的配置参数启动为不同的角色,每一个进程都引用它的目标角色服务。
| 组件名称 | 功能 |
|---|---|
| 分发器 / 调度器(distributor) | 验证数据合规;数据排序;hash 一致性;QPS 限制;转发;数据副本保证不丢失 |
| 收集器(ingester) | 时间戳排序;文件系统支持;WAL 预写; |
| 查询前端(query-frontend) | 提供页面操作,向后端存储发出数据查询;查询队列(query-queueing)能够防止大数据量查询时触发 OOM;查询分割(query-split)可以分割大批量查询最后进行数据聚合 |
| 查询器 Querier | 使用 logql 语言在后端存储中查询日志 |
| 缓存 | 将查询到的日志缓存起来共后续使用,如果数据不完整重新查询缺失的数据 |
大显身手之服务端部署
上面我们讲了那么多关于 loki 的介绍和它的工作模式,你也一定期待它是怎么部署的吧?!该怎么部署、部署在哪里、部署后怎么使用等等问题都会出现在你的脑海里。在部署之前你需要准备好一个 k8s 集群才行哦。那好,接下来耐着性子往下看……
| 应用 | 镜像 |
|---|---|
| loki | grafana/loki:2.5.0 |
| promtail | grafana/promtail:2.5.0 |
AllInOne 部署模式
① k8s 部署
我们从 github 上下载的程序是没有配置文件的,需要提前将文件准备一份。这里提供了一份完整的 allInOne 配置文件,部分内容进行了优化。
配置文件内容如下所示
auth_enabled: false
target: all
ballast_bytes: 20480
server:
  grpc_listen_port: 9095
  http_listen_port: 3100
  graceful_shutdown_timeout: 20s
  grpc_listen_address: "0.0.0.0"
  grpc_listen_network: "tcp"
  grpc_server_max_concurrent_streams: 100
  grpc_server_max_recv_msg_size: 4194304
  grpc_server_max_send_msg_size: 4194304
  http_server_idle_timeout: 2m
  http_listen_address: "0.0.0.0"
  http_listen_network: "tcp"
  http_server_read_timeout: 30s
  http_server_write_timeout: 20s
  log_source_ips_enabled: true
  ## http_path_prefix如果需要更改,在推送日志的时候前缀都需要加指定的内容
  ## http_path_prefix: "/"
  register_instrumentation: true
  log_format: json
  log_level: info
distributor:
  ring:
    heartbeat_timeout: 3s
    kvstore:
      prefix: collectors/
      store: memberlist
      ## 需要提前创建好consul集群
    ##   consul:
    ##     http_client_timeout: 20s
    ##     consistent_reads: true
    ##     host: 127.0.0.1:8500
    ##     watch_burst_size: 2
    ##     watch_rate_limit: 2
querier:
  engine:
    max_look_back_period: 20s
    timeout: 3m0s
  extra_query_delay: 100ms
  max_concurrent: 10
  multi_tenant_queries_enabled: true
  query_ingester_only: false
  query_ingesters_within: 3h0m0s
  query_store_only: false
  query_timeout: 5m0s
  tail_max_duration: 1h0s
query_scheduler:
  max_outstanding_requests_per_tenant: 2048
  grpc_client_config:
    max_recv_msg_size: 104857600
    max_send_msg_size: 16777216
    grpc_compression: gzip
    rate_limit: 0
    rate_limit_burst: 0
    backoff_on_ratelimits: false
    backoff_config:
      min_period: 50ms
      max_period: 15s
      max_retries: 5
  use_scheduler_ring: true
  scheduler_ring:
    kvstore:
      store: memberlist
      prefix: "collectors/"
    heartbeat_period: 30s
    heartbeat_timeout: 1m0s
    ## 默认第一个网卡的名称
    ## instance_interface_names
    ## instance_addr: 127.0.0.1
    ## 默认server.grpc-listen-port
    instance_port: 9095
frontend:
  max_outstanding_per_tenant: 4096
  querier_forget_delay: 1h0s
  compress_responses: true
  log_queries_longer_than: 2m0s
  max_body_size: 104857600
  query_stats_enabled: true
  scheduler_dns_lookup_period: 10s
  scheduler_worker_concurrency: 15
query_range:
  align_queries_with_step: true
  cache_results: true
  parallelise_shardable_queries: true
  max_retries: 3
  results_cache:
    cache:
      enable_fifocache: false
      default_validity: 30s
      background:
        writeback_buffer: 10000
      redis:
        endpoint: 127.0.0.1:6379
        timeout: 1s
        expiration: 0s
        db: 9
        pool_size: 128
        password: 1521Qyx6^
        tls_enabled: false
        tls_insecure_skip_verify: true
        idle_timeout: 10s
        max_connection_age: 8h
ruler:
  enable_api: true
  enable_sharding: true
  alertmanager_refresh_interval: 1m
  disable_rule_group_label: false
  evaluation_interval: 1m0s
  flush_period: 3m0s
  for_grace_period: 20m0s
  for_outage_tolerance: 1h0s
  notification_queue_capacity: 10000
  notification_timeout: 4s
  poll_interval: 10m0s
  query_stats_enabled: true
  remote_write:
    config_refresh_period: 10s
    enabled: false
  resend_delay: 2m0s
  rule_path: /rulers
  search_pending_for: 5m0s
  storage:
    local:
      directory: /data/loki/rulers
    type: configdb
  sharding_strategy: default
  wal_cleaner:
    period:  240h
    min_age: 12h0m0s
  wal:
    dir: /data/loki/ruler_wal
    max_age: 4h0m0s
    min_age: 5m0s
    truncate_frequency: 1h0m0s
  ring:
    kvstore:
      store: memberlist
      prefix: "collectors/"
    heartbeat_period: 5s
    heartbeat_timeout: 1m0s
    ## instance_addr: "127.0.0.1"
    ## instance_id: "miyamoto.en0"
    ## instance_interface_names: ["en0","lo0"]
    instance_port: 9500
    num_tokens: 100
ingester_client:
  pool_config:
    health_check_ingesters: false
    client_cleanup_period: 10s
    remote_timeout: 3s
  remote_timeout: 5s
ingester:
  autoforget_unhealthy: true
  chunk_encoding: gzip
  chunk_target_size: 1572864
  max_transfer_retries: 0
  sync_min_utilization: 3.5
  sync_period: 20s
  flush_check_period: 30s
  flush_op_timeout: 10m0s
  chunk_retain_period: 1m30s
  chunk_block_size: 262144
  chunk_idle_period: 1h0s
  max_returned_stream_errors: 20
  concurrent_flushes: 3
  index_shards: 32
  max_chunk_age: 2h0m0s
  query_store_max_look_back_period: 3h30m30s
  wal:
    enabled: true
    dir: /data/loki/wal
    flush_on_shutdown: true
    checkpoint_duration: 15m
    replay_memory_ceiling: 2GB
  lifecycler:
    ring:
      kvstore:
        store: memberlist
        prefix: "collectors/"
      heartbeat_timeout: 30s
      replication_factor: 1
    num_tokens: 128
    heartbeat_period: 5s
    join_after: 5s
    observe_period: 1m0s
    ## interface_names: ["en0","lo0"]
    final_sleep: 10s
    min_ready_duration: 15s
storage_config:
  boltdb:
    directory: /data/loki/boltdb
  boltdb_shipper:
    active_index_directory: /data/loki/active_index
    build_per_tenant_index: true
    cache_location: /data/loki/cache
    cache_ttl: 48h
    resync_interval: 5m
    query_ready_num_days: 5
    index_gateway_client:
      grpc_client_config:
  filesystem:
    directory: /data/loki/chunks
chunk_store_config:
  chunk_cache_config:
    enable_fifocache: true
    default_validity: 30s
    background:
      writeback_buffer: 10000
    redis:
      endpoint: 192.168.3.56:6379
      timeout: 1s
      expiration: 0s
      db: 8
      pool_size: 128
      password: 1521Qyx6^
      tls_enabled: false
      tls_insecure_skip_verify: true
      idle_timeout: 10s
      max_connection_age: 8h
    fifocache:
      ttl: 1h
      validity: 30m0s
      max_size_items: 2000
      max_size_bytes: 500MB
  write_dedupe_cache_config:
    enable_fifocache: true
    default_validity: 30s
    background:
      writeback_buffer: 10000
    redis:
      endpoint: 127.0.0.1:6379
      timeout: 1s
      expiration: 0s
      db: 7
      pool_size: 128
      password: 1521Qyx6^
      tls_enabled: false
      tls_insecure_skip_verify: true
      idle_timeout: 10s
      max_connection_age: 8h
    fifocache:
      ttl: 1h
      validity: 30m0s
      max_size_items: 2000
      max_size_bytes: 500MB
  cache_lookups_older_than: 10s
## 压缩碎片索引
compactor:
  shared_store: filesystem
  shared_store_key_prefix: index/
  working_directory: /data/loki/compactor
  compaction_interval: 10m0s
  retention_enabled: true
  retention_delete_delay: 2h0m0s
  retention_delete_worker_count: 150
  delete_request_cancel_period: 24h0m0s
  max_compaction_parallelism: 2
  ## compactor_ring:
frontend_worker:
  match_max_concurrent: true
  parallelism: 10
  dns_lookup_duration: 5s
## runtime_config 这里没有配置任何信息
## runtime_config:
common:
  storage:
    filesystem:
      chunks_directory: /data/loki/chunks
      fules_directory: /data/loki/rulers
  replication_factor: 3
  persist_tokens: false
  ## instance_interface_names: ["en0","eth0","ens33"]
analytics:
  reporting_enabled: false
limits_config:
  ingestion_rate_strategy: global
  ingestion_rate_mb: 100
  ingestion_burst_size_mb: 18
  max_label_name_length: 2096
  max_label_value_length: 2048
  max_label_names_per_series: 60
  enforce_metric_name: true
  max_entries_limit_per_query: 5000
  reject_old_samples: true
  reject_old_samples_max_age: 168h
  creation_grace_period: 20m0s
  max_global_streams_per_user: 5000
  unordered_writes: true
  max_chunks_per_query: 200000
  max_query_length: 721h
  max_query_parallelism: 64
  max_query_series: 700
  cardinality_limit: 100000
  max_streams_matchers_per_query: 1000
  max_concurrent_tail_requests: 10
  ruler_evaluation_delay_duration: 3s
  ruler_max_rules_per_rule_group: 0
  ruler_max_rule_groups_per_tenant: 0
  retention_period: 700h
  per_tenant_override_period: 20s
  max_cache_freshness_per_query: 2m0s
  max_queriers_per_tenant: 0
  per_stream_rate_limit: 6MB
  per_stream_rate_limit_burst: 50MB
  max_query_lookback: 0
  ruler_remote_write_disabled: false
  min_sharding_lookback: 0s
  split_queries_by_interval: 10m0s
  max_line_size: 30mb
  max_line_size_truncate: false
  max_streams_per_user: 0

## memberlist_conig模块配置gossip用于在分发服务器、摄取器和查询器之间发现和连接。
## 所有三个组件的配置都是唯一的,以确保单个共享环。
## 至少定义了1个join_members配置后,将自动为分发服务器、摄取器和ring 配置memberlist类型的kvstore
memberlist:
  randomize_node_name: true
  stream_timeout: 5s
  retransmit_factor: 4
  join_members:
  - 'loki-memberlist'
  abort_if_cluster_join_fails: true
  advertise_addr: 0.0.0.0
  advertise_port: 7946
  bind_addr: ["0.0.0.0"]
  bind_port: 7946
  compression_enabled: true
  dead_node_reclaim_time: 30s
  gossip_interval: 100ms
  gossip_nodes: 3
  gossip_to_dead_nodes_time: 3
  ## join:
  leave_timeout: 15s
  left_ingesters_timeout: 3m0s
  max_join_backoff: 1m0s
  max_join_retries: 5
  message_history_buffer_bytes: 4096
  min_join_backoff: 2s
  ## node_name: miyamoto
  packet_dial_timeout: 5s
  packet_write_timeout: 5s
  pull_push_interval: 100ms
  rejoin_interval: 10s
  tls_enabled: false
  tls_insecure_skip_verify: true
schema_config:
  configs:
  - from: "2020-10-24"
    index:
      period: 24h
      prefix: index_
    object_store: filesystem
    schema: v11
    store: boltdb-shipper
    chunks:
      period: 168h
    row_shards: 32
table_manager:
  retention_deletes_enabled: false
  retention_period: 0s
  throughput_updates_disabled: false
  poll_interval: 3m0s
  creation_grace_period: 20m
  index_tables_provisioning:
    provisioned_write_throughput: 1000
    provisioned_read_throughput: 500
    inactive_write_throughput: 4
    inactive_read_throughput: 300
    inactive_write_scale_lastn: 50
    enable_inactive_throughput_on_demand_mode: true
    enable_ondemand_throughput_mode: true
    inactive_read_scale_lastn: 10
    write_scale:
      enabled: true
      target: 80
      ## role_arn:
      out_cooldown: 1800
      min_capacity: 3000
      max_capacity: 6000
      in_cooldown: 1800
    inactive_write_scale:
      enabled: true
      target: 80
      out_cooldown: 1800
      min_capacity: 3000
      max_capacity: 6000
      in_cooldown: 1800
    read_scale:
      enabled: true
      target: 80
      out_cooldown: 1800
      min_capacity: 3000
      max_capacity: 6000
      in_cooldown: 1800
    inactive_read_scale:
      enabled: true
      target: 80
      out_cooldown: 1800
      min_capacity: 3000
      max_capacity: 6000
      in_cooldown: 1800
  chunk_tables_provisioning:
    enable_inactive_throughput_on_demand_mode: true
    enable_ondemand_throughput_mode: true
    provisioned_write_throughput: 1000
    provisioned_read_throughput: 300
    inactive_write_throughput: 1
    inactive_write_scale_lastn: 50
    inactive_read_throughput: 300
    inactive_read_scale_lastn: 10
    write_scale:
      enabled: true
      target: 80
      out_cooldown: 1800
      min_capacity: 3000
      max_capacity: 6000
      in_cooldown: 1800
    inactive_write_scale:
      enabled: true
      target: 80
      out_cooldown: 1800
      min_capacity: 3000
      max_capacity: 6000
      in_cooldown: 1800
    read_scale:
      enabled: true
      target: 80
      out_cooldown: 1800
      min_capacity: 3000
      max_capacity: 6000
      in_cooldown: 1800
    inactive_read_scale:
      enabled: true
      target: 80
      out_cooldown: 1800
      min_capacity: 3000
      max_capacity: 6000
      in_cooldown: 1800
tracing:
  enabled: true
复制代码
注意 :
ingester.lifecycler.ring.replication_factor的值在单实例的情况下为1ingester.lifecycler.min_ready_duration的值为 15s,在启动后默认会显示 15 秒将状态变为ready
memberlist.node_name的值可以不用设置,默认是当前主机的名称memberlist.join_members是一个列表,在有多个实例的情况下需要添加各个节点的主机名 /IP 地址。在 k8s 里面可以设置成一个service绑定到StatefulSets。query_range.results_cache.cache.enable_fifocache建议设置为false,我这里设置成了trueinstance_interface_names是一个列表,默认的为["en0","eth0"],可以根据需要设置对应的网卡名称,一般不需要进行特殊设置。
创建 configmap
说明:将上面的内容写入到一个文件——>loki-all.yaml,把它作为一个 configmap 写入 k8s 集群。可以使用如下命令创建:
$ kubectl create configmap --from-file ./loki-all.yaml loki-all可以通过命令查看到已经创建好的 configmap,具体操作详见下图

创建持久化存储
在 k8s 里面我们的数据是需要进行持久化的。Loki 收集起来的日志信息对于业务来说是至关重要的,因此需要在容器重启的时候日志能够保留下来。那么就需要用到 pv、pvc,后端存储可以使用 nfs、glusterfs、hostPath、azureDisk、cephfs 等 20 种支持类型,这里因为没有对应的环境就采用了 hostPath 方式。
apiVersion: v1
kind: PersistentVolume
metadata:
  name: loki
  namespace: default
spec:
  hostPath:
    path: /glusterfs/loki
    type: DirectoryOrCreate
  capacity:
    storage: 1Gi
  accessModes:
    - ReadWriteMany
---
apiVersion: v1
kind: PersistentVolumeClaim
metadata:
  name: loki
  namespace: default
spec:
  accessModes:
    - ReadWriteMany
  resources:
    requests:
      storage: 1Gi
  volumeName: loki
创建应用
准备好 k8s 的 StatefulSet 部署文件后就可以直接在集群里面创建应用了。
apiVersion: apps/v1
kind: StatefulSet
metadata:
  labels:
    app: loki
  name: loki
  namespace: default
spec:
  podManagementPolicy: OrderedReady
  replicas: 1
  selector:
    matchLabels:
      app: loki
  template:
    metadata:
      annotations:
        prometheus.io/port: http-metrics
        prometheus.io/scrape: "true"
      labels:
        app: loki
    spec:
      containers:
      - args:
        - -config.file=/etc/loki/loki-all.yaml
        image: grafana/loki:2.5.0
        imagePullPolicy: IfNotPresent
        livenessProbe:
          failureThreshold: 3
          httpGet:
            path: /ready
            port: http-metrics
            scheme: HTTP
          initialDelaySeconds: 45
          periodSeconds: 10
          successThreshold: 1
          timeoutSeconds: 1
        name: loki
        ports:
        - containerPort: 3100
          name: http-metrics
          protocol: TCP
        - containerPort: 9095
          name: grpc
          protocol: TCP
        - containerPort: 7946
          name: memberlist-port
          protocol: TCP
        readinessProbe:
          failureThreshold: 3
          httpGet:
            path: /ready
            port: http-metrics
            scheme: HTTP
          initialDelaySeconds: 45
          periodSeconds: 10
          successThreshold: 1
          timeoutSeconds: 1
        resources:
          requests:
            cpu: 500m
            memory: 500Mi
          limits:
            cpu: 500m
            memory: 500Mi
        securityContext:
          readOnlyRootFilesystem: true
        volumeMounts:
        - mountPath: /etc/loki
          name: config
        - mountPath: /data
          name: storage
      restartPolicy: Always
      securityContext:
        fsGroup: 10001
        runAsGroup: 10001
        runAsNonRoot: true
        runAsUser: 10001
      serviceAccount: loki
      serviceAccountName: loki
      volumes:
      - emptyDir: {}
        name: tmp
      - name: config
        configMap:
          name: loki
      - persistentVolumeClaim:
          claimName: loki
        name: storage
---
kind: Service
apiVersion: v1
metadata:
  name: loki-memberlist
  namespace: default
spec:
  ports:
    - name: loki-memberlist
      protocol: TCP
      port: 7946
      targetPort: 7946
  selector:
    kubepi.org/name: loki
---
kind: Service
apiVersion: v1
metadata:
  name: loki
  namespace: default
spec:
  ports:
    - name: loki
      protocol: TCP
      port: 3100
      targetPort: 3100
  selector:
    kubepi.org/name: loki
在上面的配置文件中我添加了一些 pod 级别的安全策略,这些安全策略还有集群级别的 PodSecurityPolicy,防止因为漏洞的原因造成集群的整个崩溃,关于集群级别的 psp,可以详见官方文档[1]。
验证部署结果
当看到上面的 Running 状态时可以通过 API 的方式看一下分发器是不是正常工作,当显示 Active 时正常才会正常分发日志流到收集器(ingester)。
② 裸机部署
将 loki 放到系统的 /bin/ 目录下,准备 grafana-loki.service 控制文件重载系统服务列表
[Unit]
Description=Grafana Loki Log Ingester
Documentation=https://grafana.com/logs/
After=network-online.target

[Service]
ExecStart=/bin/loki --config.file /etc/loki/loki-all.yaml
ExecReload=/bin/kill -s HUP $MAINPID
ExecStop=/bin/kill -s TERM $MAINPID

[Install]
WantedBy=multi-user.target
重载系统列表命令,可以直接系统自动管理服务:
$ systemctl daemon-reload
## 启动服务
$ systemctl start grafana-loki
## 停止服务
$ systemctl stop grafana-loki
## 重载应用
$ systemctl reload grafana-loki
大显身手之 Promtail 部署
部署客户端收集日志时也需要创建一个配置文件,按照上面创建服务端的步骤创建。不同的是需要把日志内容 push 到服务端
① k8s 部署
创建配置文件
server:
  log_level: info
  http_listen_port: 3101
clients:
  - url: http://loki:3100/loki/api/v1/push
positions:
  filename: /run/promtail/positions.yaml
scrape_configs:
  - job_name: kubernetes-pods
    pipeline_stages:
      - cri: {}
    kubernetes_sd_configs:
      - role: pod
    relabel_configs:
      - source_labels:
          - __meta_kubernetes_pod_controller_name
        regex: ([0-9a-z-.]+?)(-[0-9a-f]{8,10})?
        action: replace
        target_label: __tmp_controller_name
      - source_labels:
          - __meta_kubernetes_pod_label_app_kubernetes_io_name
          - __meta_kubernetes_pod_label_app
          - __tmp_controller_name
          - __meta_kubernetes_pod_name
        regex: ^;*([^;]+)(;.*)?$
        action: replace
        target_label: app
      - source_labels:
          - __meta_kubernetes_pod_label_app_kubernetes_io_instance
          - __meta_kubernetes_pod_label_release
        regex: ^;*([^;]+)(;.*)?$
        action: replace
        target_label: instance
      - source_labels:
          - __meta_kubernetes_pod_label_app_kubernetes_io_component
          - __meta_kubernetes_pod_label_component
        regex: ^;*([^;]+)(;.*)?$
        action: replace
        target_label: component
      - action: replace
        source_labels:
        - __meta_kubernetes_pod_node_name
        target_label: node_name
      - action: replace
        source_labels:
        - __meta_kubernetes_namespace
        target_label: namespace
      - action: replace
        replacement: $1
        separator: /
        source_labels:
        - namespace
        - app
        target_label: job
      - action: replace
        source_labels:
        - __meta_kubernetes_pod_name
        target_label: pod
      - action: replace
        source_labels:
        - __meta_kubernetes_pod_container_name
        target_label: container
      - action: replace
        replacement: /var/log/pods/*$1/*.log
        separator: /
        source_labels:
        - __meta_kubernetes_pod_uid
        - __meta_kubernetes_pod_container_name
        target_label: __path__
      - action: replace
        regex: true/(.*)
        replacement: /var/log/pods/*$1/*.log
        separator: /
        source_labels:
        - __meta_kubernetes_pod_annotationpresent_kubernetes_io_config_hash
        - __meta_kubernetes_pod_annotation_kubernetes_io_config_hash
        - __meta_kubernetes_pod_container_name
        target_label: __path__
用上面的内容创建一个 configMap,方法同上
创建 DaemonSet 文件
Promtail 是一个无状态应用不需要进行持久化存储只需要部署到集群里面就可以了,还是同样的准备 DaemonSets 创建文件。
kind: DaemonSet
apiVersion: apps/v1
metadata:
  name: promtail
  namespace: default
  labels:
    app.kubernetes.io/instance: promtail
    app.kubernetes.io/name: promtail
    app.kubernetes.io/version: 2.5.0
spec:
  selector:
    matchLabels:
      app.kubernetes.io/instance: promtail
      app.kubernetes.io/name: promtail
  template:
    metadata:
      labels:
        app.kubernetes.io/instance: promtail
        app.kubernetes.io/name: promtail
    spec:
      volumes:
        - name: config
          configMap:
            name: promtail
        - name: run
          hostPath:
            path: /run/promtail
        - name: containers
          hostPath:
            path: /var/lib/docker/containers
        - name: pods
          hostPath:
            path: /var/log/pods
      containers:
        - name: promtail
          image: docker.io/grafana/promtail:2.3.0
          args:
            - '-config.file=/etc/promtail/promtail.yaml'
          ports:
            - name: http-metrics
              containerPort: 3101
              protocol: TCP
          env:
            - name: HOSTNAME
              valueFrom:
                fieldRef:
                  apiVersion: v1
                  fieldPath: spec.nodeName
          volumeMounts:
            - name: config
              mountPath: /etc/promtail
            - name: run
              mountPath: /run/promtail
            - name: containers
              readOnly: true
              mountPath: /var/lib/docker/containers
            - name: pods
              readOnly: true
              mountPath: /var/log/pods
          readinessProbe:
            httpGet:
              path: /ready
              port: http-metrics
              scheme: HTTP
            initialDelaySeconds: 10
            timeoutSeconds: 1
            periodSeconds: 10
            successThreshold: 1
            failureThreshold: 5
          imagePullPolicy: IfNotPresent
          securityContext:
            capabilities:
              drop:
                - ALL
            readOnlyRootFilesystem: false
            allowPrivilegeEscalation: false
      restartPolicy: Always
      serviceAccountName: promtail
      serviceAccount: promtail
      tolerations:
        - key: node-role.kubernetes.io/master
          operator: Exists
          effect: NoSchedule
        - key: node-role.kubernetes.io/control-plane
          operator: Exists
          effect: NoSchedule
创建 promtail 应用
$ kubectl apply -f promtail.yaml使用上面这个命令创建后就可以看到服务已经创建好了。接下来就是在 Grafana 里面添加 DataSource 查看数据了。
② 裸机部署
如果是裸机部署的情况下,需要对上面的配置文件做一下稍微的改动,更改 clients 得地址就可以,文件存放到 /etc/loki/ 下,例如改成:
clients:
  - url: http://ipaddress:port/loki/api/v1/push
添加系统开机启动配置,service 配置文件存放位置 /usr/lib/systemd/system/loki-promtail.service 内容如下
[Unit]
Description=Grafana Loki Log Ingester
Documentation=https://grafana.com/logs/
After=network-online.target

[Service]
ExecStart=/bin/promtail --config.file /etc/loki/loki-promtail.yaml
ExecReload=/bin/kill -s HUP $MAINPID
ExecStop=/bin/kill -s TERM $MAINPID

[Install]
WantedBy=multi-user.target
启动方式同上面服务端部署内容
Loki in DataSource
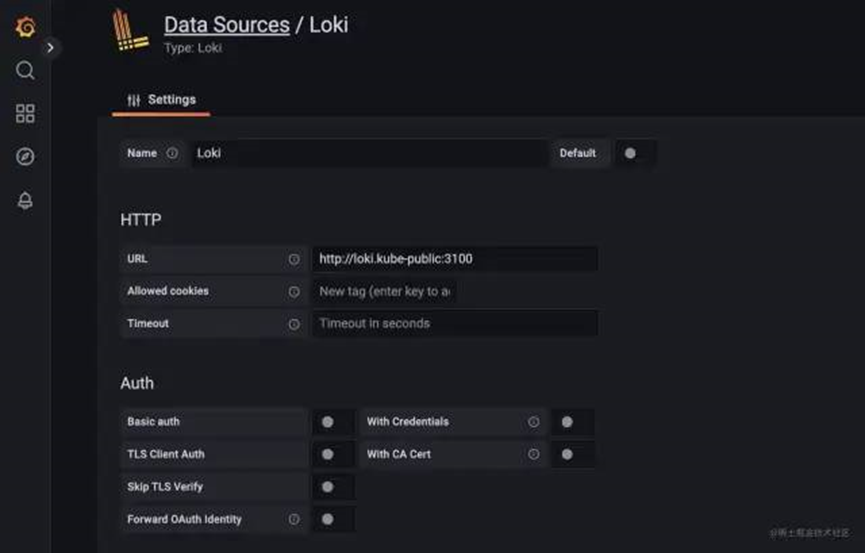
添加数据源
具体步骤 : Grafana->Setting->DataSources->AddDataSource->Loki
注意点: http 的 URL 地址,应用、服务部署在哪个 namespace 下,就需要指定它的 FQDN 地址,它的格式是 ServiceName.namespace。如果默认在 default 下、创建的端口号是 3100,就需要填写为 http://loki:3100,这里为什么不写 IP 地址而写成服务的名字,是因为在 k8s 集群里面有个 dns 服务器会自动解析这个地址。
查找日志信息
其他客户端配置
Logstash 作为日志收集客户端
安装插件
在启动 Logstash 后我们需要安装一个插件,可以通过这个命令安装 loki 的输出插件,安装完成之后可以在 logstash 的 output 中添加信息。
$ bin/logstash-plugin install logstash-output-loki添加配置进行测试
完整的 logstash 配置信息,可以参考官网给出的内容LogstashConfigFile[2]
output {
  loki {
    [url => "" | default = none | required=true]
    [tenant_id => string | default = nil | required=false]
    [message_field => string | default = "message" | required=false]
    [include_fields => array | default = [] | required=false]
    [batch_wait => number | default = 1(s) | required=false]
    [batch_size => number | default = 102400(bytes) | required=false]
    [min_delay => number | default = 1(s) | required=false]
    [max_delay => number | default = 300(s) | required=false]
    [retries => number | default = 10 | required=false]
    [username => string | default = nil | required=false]
    [password => secret | default = nil | required=false]
    [cert => path | default = nil | required=false]
    [key => path | default = nil| required=false]
    [ca_cert => path | default = nil | required=false]
    [insecure_skip_verify => boolean | default = false | required=false]
  }
}
或者采用 logstash 的 http 输出模块,配置如下:
output {
    http {
        format => "json"
        http_method => "post"
        content_type => "application/json"
        connect_timeout => 10
        url => "http://loki:3100/loki/api/v1/push"
        message => '"message":"%{message}"}'
    }
}
Helm 安装
如果你想简便安装的话,可以采用 helm 来安装。helm 将所有的安装步骤都进行了封装,简化了安装步骤。对于想详细了解 k8s 的人来说,helm 不太适合。因为它封装后自动执行,k8s 管理员不知道各组件之间是如何依赖的,可能会造成误区。 废话不多说,下面开始 helm 安装
添加 repo 源
$ helm repo add grafana https://grafana.github.io/helm-charts更新源
$ helm repo update部署
默认配置
$ helm upgrade --install loki grafana/loki-simple-scalable自定义 namespace
$ helm upgrade --install loki --namespace=loki grafana/loki-simple-scalable自定义配置信息
$ helm upgrade --install loki grafana/loki-simple-scalable --set "key1=val1,key2=val2,..."故障解决方案
502 BadGateWay
- loki 的地址填写不正确
http://LokiServiceNamehttp://LokiServiceName.namespacehttp://LokiServiceName.namespace:ServicePort- 在 k8s 里面,地址填写错误造成了 502。检查一下 loki 的地址是否是以下内容:
- grafana 和 loki 在不同的节点上,检查一下节点间网络通信状态、防火墙策略
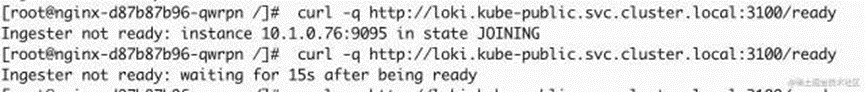
Ingester not ready: instance xx:9095 in state JOINING
- 耐心等待一会,因为是 allInOne 模式程序启动需要一定的时间。
too many unhealthy instances in the ring
- 将
ingester.lifecycler.replication_factor改为 1,是因为这个设置不正确造成的。这个在启动的时候会设置为多个复制源,但当前只部署了一个所以在查看 label 的时候提示这个。
Data source connected, but no labels received. Verify that Loki and Promtail is configured properly
- promtail 无法将收集到的日志发送给 loki,许可检查一下 promtail 的输出是不是正常;
- promtail 在 loki 还没有准备就绪的时候把日志发送过来了,但 loki 没有接收到。如果需要重新接收日志,需要删除
positions.yaml文件,具体路径可以用find查找一下位置; - promtail 忽略了目标日志文件或者配置文件错误造成的无法正常启动;
- promtail 无法在指定的位置发现日志文件 配置文件参考 1[3]。
引用链接
[1]官方文档: https://link.juejin.cn?target=https%3A%2F%2Fkubernetes.io%2Fdocs%2Fconcepts%2Fsecurity%2Fpod-security-policy%2F
[2]LogstashConfigFile: https://link.juejin.cn?target=https%3A%2F%2Fwww.elastic.co%2Fguide%2Fen%2Flogstash%2Fcurrent%2Fconfiguration-file-structure.html
[3]配置文件参考 1: https://link.juejin.cn?target=https%3A%2F%2Fgrafana.com%2Fdocs%2Floki%2Flatest%2Fconfiguration%2F%23server


暂无评论内容