

Promethues针对Mongodb的监控
采用elasticsearch_exporter收集数据,并利用grafna展示数据。
- 1、快速安装elasticsearch
- 2、安装部署elasticsearch_exporter
- 3、配置promethues
- 4、配置grafna
一、安装jdk 和elasticsearch
- 快速安装
yum install -y java-1.8.0-openjdk
rpm --import https://artifacts.elastic.co/GPG-KEY-elasticsearch
cat >/etc/yum.repos.d/elasticsearch.repo <<EOF

[elasticsearch-7.x]
name=Elasticsearch repository for 7.x packages
baseurl=https://artifacts.elastic.co/packages/7.x/yum
gpgcheck=1
gpgkey=https://artifacts.elastic.co/GPG-KEY-elasticsearch
enabled=1
autorefresh=1
type=rpm-md
EOF
yum install -y elasticsearch- 配置文件 useradd elasticsearch vim /etc/elasticsearch/elasticsearch.yml
cluster.name: my-application
node.name: node-1
path.data: /var/lib/elasticsearch
path.logs: /var/log/elasticsearch
network.host: 10.0.0.11
http.port: 9200
cluster.initial_master_nodes: ["node-1"]- 启动
systemctl start elasticsearch.service- 查看状态信息
[root@Prometheus ~]# curl http://10.0.0.11:9200
{
  "name" : "node-1",
  "cluster_name" : "my-application",
  "cluster_uuid" : "3cKNDDUuQGG9_60G_Urc5A",
  "version" : {
    "number" : "7.6.0",
    "build_flavor" : "default",
    "build_type" : "rpm",
    "build_hash" : "7f634e9f44834fbc12724506cc1da681b0c3b1e3",
    "build_date" : "2020-02-06T00:09:00.449973Z",
    "build_snapshot" : false,
    "lucene_version" : "8.4.0",
    "minimum_wire_compatibility_version" : "6.8.0",
    "minimum_index_compatibility_version" : "6.0.0-beta1"
  },
  "tagline" : "You Know, for Search"
}

[root@Prometheus elasticsearch_exporter]# curl http://10.0.0.11:9200/_cat/health
1582958895 06:48:15 my-application green 1 1 0 0 0 0 0 0 - 100.0%
二、下载elasticsearch_exporter收集elasticsearch数据
- 1、安装部署
wget https://github.com/justwatchcom/elasticsearch_exporter/releases/download/v1.1.0/elasticsearch_exporter-1.1.0.linux-amd64.tar.gz
tar zxvf elasticsearch_exporter-1.1.0.linux-amd64.tar.gz
mv elasticsearch_exporter-1.1.0.linux-amd64 /usr/local/exporter/elasticsearch_exporter
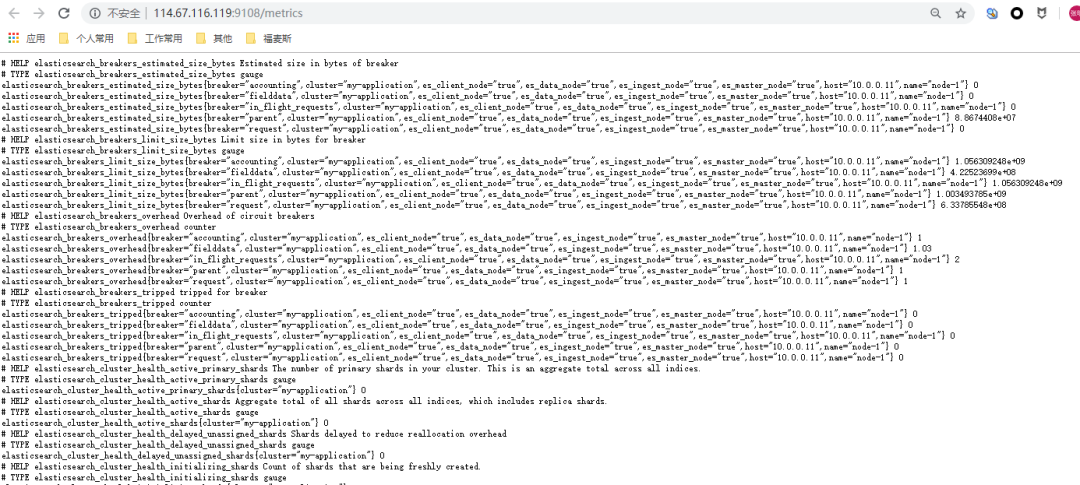
nohup ./elasticsearch_exporter --web.listen-address "0.0.0.0:9108" --es.uri http://10.0.0.11:9200 &
nohup ./elasticsearch_exporter --web.listen-address "0.0.0.0:9108" --es.uri http://elastic:******@10.0.0.11:9200 &- 2、 访问metrics curl localhost:9108/metrics
三、配置Prometheus
vim /usr/local/prometheus/prometheus.yml
  - job_name: elasticsearch
    metrics_path: "/metrics"
    static_configs:
    - targets: ['114.67.116.119:9108']
      labels:
        instance: elasticsearch
        group: inner
重启动
kill 26765
/usr/local/prometheus/prometheus --config.file=/usr/local/prometheus/prometheus.yml
或者
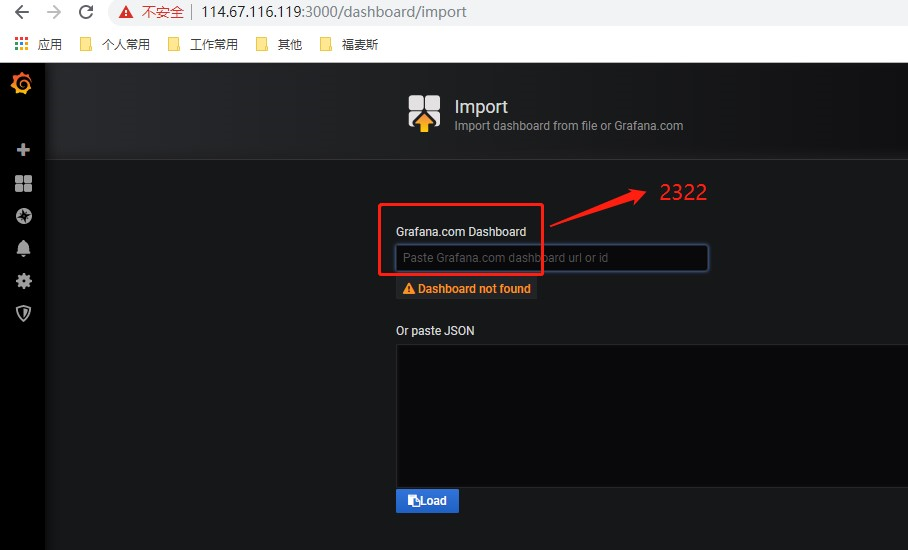
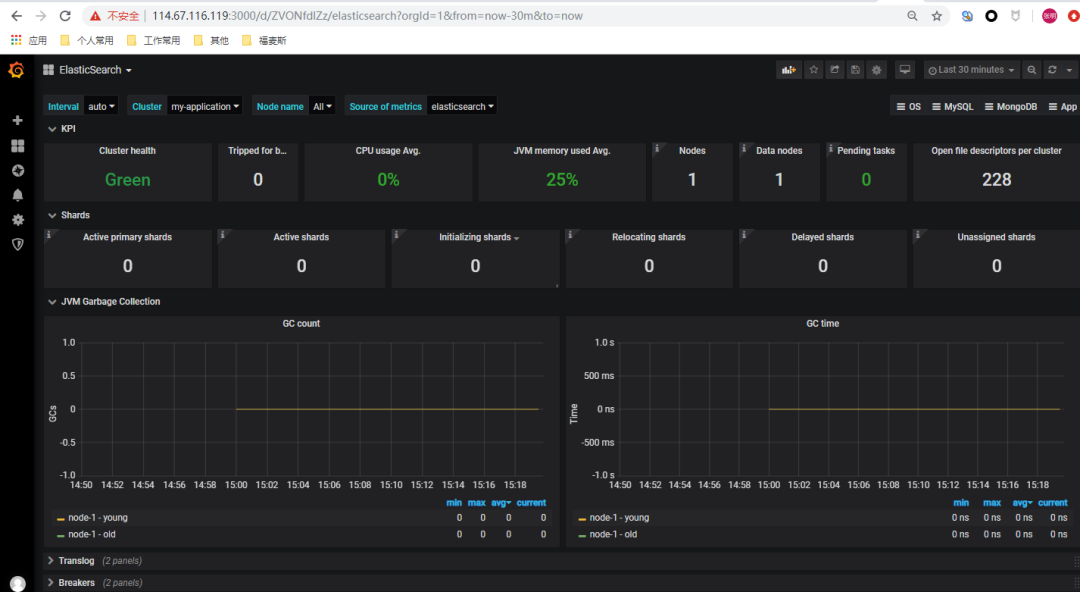
kill -hup 26765四、配置grafana
导入模板2322 Grafana Dashboard:https://grafana.com/grafana/dashboards/2322