


监控Kubernetes APIServer
写在前面
如果是用的公有云托管的 Kubernetes 集群,控制面的组件都交由云厂商托管的,那作为客户的我们就省事了,基本不用操心 APIServer 的运维。个人也推荐使用云厂商这个服务,毕竟 Kubernetes 还是有点复杂的,升级也不好搞,我们自己来维护整个集群,性价比有点低。当然,如果因为各种原因最后我们还是要维护控制面这些组件,那就要好好看看本系列接下来的几篇博客了。
黑盒测试
APIServer 在 Kubernetes 架构中非常核心,是所有 API 的入口,APIServer 也暴露了 metrics 数据,我们尝试获取一下:
[root@tt-fc-dev01.nj etcd]# ss -tlpn|grep apiserver
LISTEN 0      128                *:6443             *:*    users:(("kube-apiserver",pid=164445,fd=7))

[root@tt-fc-dev01.nj etcd]# curl -s http://localhost:6443/metrics
Client sent an HTTP request to an HTTPS server.

[root@tt-fc-dev01.nj etcd]# curl -s -k https://localhost:6443/metrics
{
  "kind": "Status",
  "apiVersion": "v1",
  "metadata": {},
  "status": "Failure",
  "message": "forbidden: User \"system:anonymous\" cannot get path \"/metrics\"",
  "reason": "Forbidden",
  "details": {},
  "code": 403
}
解释一下上面的命令和结果。首先我通过 ss 命令查看 apiserver 模块监听在哪些端口,发现这个进程在 6443 端口有监听。然后,使用 curl 命令请求 6443 的 metrics 接口,结果又说这是一个 HTTPS Server,不能用 HTTP 协议请求。好,那我用 HTTPS 协议请求,自签证书,加了 -k 参数,返回 Forbidden,说没权限访问 /metrics 接口。OK,那看来是需要 Token 鉴权,我们创建一下相关的 ServiceAccount。
准备认证信息
下面的内容可以保存为 auth-server.yaml。
---
apiVersion: rbac.authorization.k8s.io/v1
kind: ClusterRole
metadata:
  name: categraf
rules:
  - apiGroups: [""]
    resources:
      - nodes
      - nodes/metrics
      - nodes/stats
      - nodes/proxy
      - services
      - endpoints
      - pods
    verbs: ["get", "list", "watch"]
  - apiGroups:
      - extensions
      - networking.k8s.io
    resources:
      - ingresses
    verbs: ["get", "list", "watch"]
  - nonResourceURLs: ["/metrics", "/metrics/cadvisor"]
    verbs: ["get"]
---
apiVersion: v1
kind: ServiceAccount
metadata:
  name: categraf
  namespace: flashcat
---
apiVersion: rbac.authorization.k8s.io/v1
kind: ClusterRoleBinding
metadata:
  name: categraf
roleRef:
  apiGroup: rbac.authorization.k8s.io
  kind: ClusterRole
  name: categraf
subjects:
- kind: ServiceAccount
  name: categraf
  namespace: flashcat
在上一节《Kubernetes监控手册05-监控Kubelet》中,我们为 daemonset 创建过认证信息,那个认证信息主要是用于调用 kubelet 的接口。而这次我们要调用的是 apiserver 的接口,所以增加了一些权限点,当然,上例 yaml 中给出的权限点有点多,没关系,反正都是只读的,后面再需要其他权限的时候,省的再创建新的 ServiceAccount 了。与上一讲相比,这次 ServiceAccount 名字改成了 categraf,与上一讲用到的 ServiceAccount 区分开。
通过下面的命令创建相关内容,然后查看一下是否创建成功:
[root@tt-fc-dev01.nj yamls]# kubectl apply -f auth-server.yaml -n flashcat
clusterrole.rbac.authorization.k8s.io/categraf unchanged
serviceaccount/categraf unchanged
clusterrolebinding.rbac.authorization.k8s.io/categraf unchanged

[root@tt-fc-dev01.nj yamls]# kubectl get sa categraf -n flashcat
NAME       SECRETS   AGE
categraf   1         7h13m

[root@tt-fc-dev01.nj yamls]# kubectl get sa categraf -n flashcat -o yaml
apiVersion: v1
kind: ServiceAccount
metadata:
  annotations:
    kubectl.kubernetes.io/last-applied-configuration: |
      {"apiVersion":"v1","kind":"ServiceAccount","metadata":{"annotations":{},"name":"categraf","namespace":"flashcat"}}
  creationTimestamp: "2022-11-28T05:00:17Z"
  name: categraf
  namespace: flashcat
  resourceVersion: "127151612"
  uid: 8b473b31-ce09-4abe-ae55-ea799160a9d5
secrets:
- name: categraf-token-6whbs

[root@tt-fc-dev01.nj yamls]# kubectl get secret categraf-token-6whbs -n flashcat
NAME                   TYPE                                  DATA   AGE
categraf-token-6whbs   kubernetes.io/service-account-token   3      7h15m
上例中,因为我之前创建过了,所以显示的是 unchanged,获取 sa 的时候,可以看到 AGE 已经七个多小时了。通过 -o yaml 可以看到 sa 对应的 secret 的名字,最下面那一行,可以看到 secret 名字是 categraf-token-6whbs。然后我们用这个 secret 中的 token 来调用一下 APIServer 试试:
[root@tt-fc-dev01.nj yamls]# token=`kubectl get secret categraf-token-6whbs -n flashcat -o jsonpath={.data.token} | base64 -d`
[root@tt-fc-dev01.nj yamls]# curl -s -k -H "Authorization: Bearer $token" https://localhost:6443/metrics > metrics
[root@tt-fc-dev01.nj yamls]# head -n 6 metrics
# HELP aggregator_openapi_v2_regeneration_count [ALPHA] Counter of OpenAPI v2 spec regeneration count broken down by causing APIService name and reason.
# TYPE aggregator_openapi_v2_regeneration_count counter
aggregator_openapi_v2_regeneration_count{apiservice="*",reason="startup"} 0
aggregator_openapi_v2_regeneration_count{apiservice="k8s_internal_local_delegation_chain_0000000002",reason="update"} 0
aggregator_openapi_v2_regeneration_count{apiservice="v1beta1.metrics.k8s.io",reason="add"} 0
aggregator_openapi_v2_regeneration_count{apiservice="v1beta1.metrics.k8s.io",reason="update"} 0
OK,这个新的 Token 是可以获取到数据的了,权限认证通过。
采集原理
既然 Token 已经有了,采集器抓取 APIServer 的数据的时候,只要在 Header 里传入这个 Token 理论上就可以拿到数据了。如果 APIServer 是二进制方式部署,咱们就直接通过 Categraf 的 Prometheus 插件来抓取就可以了。如果 APIServer 是部署在 Kubernetes 的容器里,咱们最好是使用服务发现机制来做。
支持 Kubernetes 服务发现的 agent 有不少,但是要说最原汁原味的还是 Prometheus 自身,Prometheus 新版本(v2.32.0)支持了 agent mode 模式,即把 Prometheus 进程当做采集器 agent,采集了数据之后通过 remote write 方式传给中心(这里使用早就准备好的 Nightingale 作为数据接收服务端)。那这里我就使用 Prometheus 的 agent mode 方式来采集 APIServer。
部署 agent mode prometheus
首先准备一下 Prometheus agent 需要的配置文件,我们做成一个 ConfigMap:
apiVersion: v1
kind: ConfigMap
metadata:
  name: prometheus-agent-conf
  labels:
    name: prometheus-agent-conf
  namespace: flashcat
data:
  prometheus.yml: |-
    global:
      scrape_interval: 15s
      evaluation_interval: 15s
    scrape_configs:
      - job_name: 'apiserver'
        kubernetes_sd_configs:
        - role: endpoints
        scheme: https
        tls_config:
          ca_file: /var/run/secrets/kubernetes.io/serviceaccount/ca.crt
        bearer_token_file: /var/run/secrets/kubernetes.io/serviceaccount/token
        relabel_configs:
        - source_labels: [__meta_kubernetes_namespace, __meta_kubernetes_service_name, __meta_kubernetes_endpoint_port_name]
          action: keep
          regex: default;kubernetes;https
    remote_write:
    - url: 'http://10.206.0.16:19000/prometheus/v1/write'
可以把上面的内容保存为 prometheus-agent-configmap.yaml,然后 kubectl -f prometheus-agent-configmap.yaml 创建一下即可。
有了配置了,下面我们就可以部署 Prometheus 了,要把 Prometheus 进程当做 agent 来用,需要启用这个 feature,通过命令行参数 --enable-feature=agent 即可轻松启用了,我们把 agent mode 模式的 Prometheus 部署成一个 Deployment,单副本。
apiVersion: apps/v1
kind: Deployment
metadata:
  name: prometheus-agent
  namespace: flashcat
  labels:
    app: prometheus-agent
spec:
  replicas: 1
  selector:
    matchLabels:
      app: prometheus-agent
  template:
    metadata:
      labels:
        app: prometheus-agent
    spec:
      serviceAccountName: categraf
      containers:
        - name: prometheus
          image: prom/prometheus
          args:
            - "--config.file=/etc/prometheus/prometheus.yml"
            - "--web.enable-lifecycle"
            - "--enable-feature=agent"
          ports:
            - containerPort: 9090
          resources:
            requests:
              cpu: 500m
              memory: 500M
            limits:
              cpu: 1
              memory: 1Gi
          volumeMounts:
            - name: prometheus-config-volume
              mountPath: /etc/prometheus/
            - name: prometheus-storage-volume
              mountPath: /prometheus/
      volumes:
        - name: prometheus-config-volume
          configMap:
            defaultMode: 420
            name: prometheus-agent-conf
        - name: prometheus-storage-volume
          emptyDir: {}
要特别注意 serviceAccountName: categraf 这一行内容别忘记了,以上 yaml 内容保存为 prometheus-agent-deployment.yaml,然后 apply 一下:
[work@tt-fc-dev01.nj yamls]$ kubectl apply -f prometheus-agent-deployment.yaml
deployment.apps/prometheus-agent created
可以通过 kubectl logs <podname> -n flashcat 查看刚才创建的 prometheus-agent-xx 那个 Pod 的日志,如果没有报错,理论上就问题不大了。
查看监控数据
在即时查询里查一下 apiserver_request_total 这个指标,如果可以查到,就说明数据上报是正常的。之前整理过 Kubernetes / Apiserver 监控大盘,可以导入测试,地址在这里。效果如下:
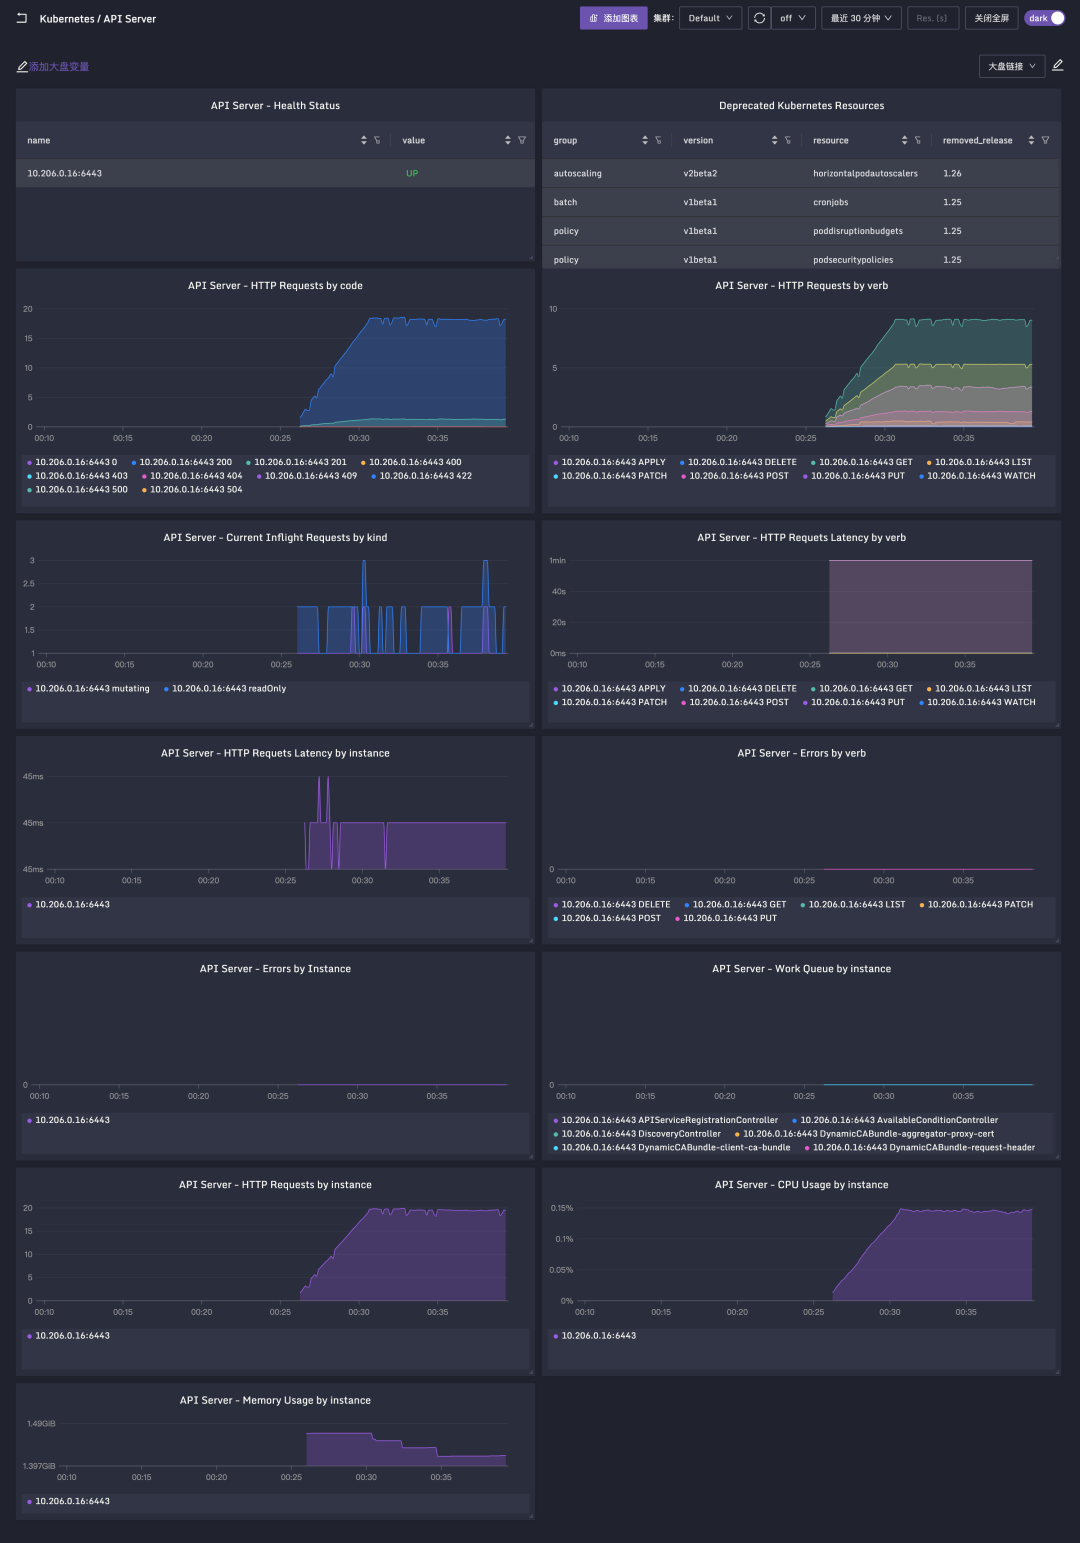
另外,Apiserver 的关键指标的含义,也做了整理,我也给摘过来了:
# HELP apiserver_request_duration_seconds [STABLE] Response latency distribution in seconds for each verb, dry run value, group, version, resource, subresource, scope and component.
# TYPE apiserver_request_duration_seconds histogram
apiserver响应的时间分布,按照url 和 verb 分类
一般按照instance和verb+时间 汇聚

# HELP apiserver_request_total [STABLE] Counter of apiserver requests broken out for each verb, dry run value, group, version, resource, scope, component, and HTTP response code.
# TYPE apiserver_request_total counter
apiserver的请求总数,按照verb、 version、 group、resource、scope、component、 http返回码分类统计

# HELP apiserver_current_inflight_requests [STABLE] Maximal number of currently used inflight request limit of this apiserver per request kind in last second.
# TYPE apiserver_current_inflight_requests gauge
最大并发请求数, 按mutating(非get list watch的请求)和readOnly(get list watch)分别限制
超过max-requests-inflight(默认值400)和max-mutating-requests-inflight(默认200)的请求会被限流
apiserver变更时要注意观察,也是反馈集群容量的一个重要指标

# HELP apiserver_response_sizes [STABLE] Response size distribution in bytes for each group, version, verb, resource, subresource, scope and component.
# TYPE apiserver_response_sizes histogram
apiserver 响应大小,单位byte, 按照verb、 version、 group、resource、scope、component分类统计

# HELP watch_cache_capacity [ALPHA] Total capacity of watch cache broken by resource type.
# TYPE watch_cache_capacity gauge
按照资源类型统计的watch缓存大小

# HELP process_cpu_seconds_total Total user and system CPU time spent in seconds.
# TYPE process_cpu_seconds_total counter
每秒钟用户态和系统态cpu消耗时间, 计算apiserver进程的cpu的使用率

# HELP process_resident_memory_bytes Resident memory size in bytes.
# TYPE process_resident_memory_bytes gauge
apiserver的内存使用量(单位:Byte)

# HELP workqueue_adds_total [ALPHA] Total number of adds handled by workqueue
# TYPE workqueue_adds_total counter
apiserver中包含的controller的工作队列,已处理的任务总数

# HELP workqueue_depth [ALPHA] Current depth of workqueue
# TYPE workqueue_depth gauge
apiserver中包含的controller的工作队列深度,表示当前队列中要处理的任务的数量,数值越小越好
例如APIServiceRegistrationController admission_quota_controller